Eighty kilometres in about an hour
The collapse began at 5,200 to 5,400 m on the north side of the Langtang Lirung massif at 08:37 Nepal time (02:52 UTC). The US Geological Survey recorded its seismic signal as event us7000tbwb; ICIMOD put its volume at 100 to 200 million m³.
The debris came down the Lhende Khola and reached Gyirong Port, on the border at Rasuwagadhi, about seven minutes later. It followed the Bhote Koshi past Timure to Syabrubesi, where the river becomes the Trishuli, and on past Betrawati to Bidur (Trishuli Bazar) in Nuwakot. It is Nepal’s deadliest natural disaster since the 2015 Gorkha earthquake.
Drag the pen on the trace at the top of the page, or press Play: the map follows the modelled front down the river, minute by minute, and marks each place as it is reached.
- Front at 08:50 (median)
- 5–95 % reach
- Our footprint (this study)
- Place reached, with modelled arrival
| Impact | Value | Source |
|---|---|---|
| Dead | 1,455 or more | USGS |
| Missing | 5,285 | USGS |
| Houses damaged | 7,570 | Government rapid assessment |
| Hydropower projects damaged | 13 (759 MW) | Government rapid assessment |
| Bridges damaged | 109 | USGS |
| Road damaged | 69 km | USGS |
| Farmland damaged | 1,806 ha | Government rapid assessment |
| Recovery needs | NPR 723 billion | Government rapid assessment |
Figures as reported in the paper: USGS event page us7000tbwb, and the government rapid assessment reported by The Kathmandu Post, 10 September 2026. They are not results of this study.
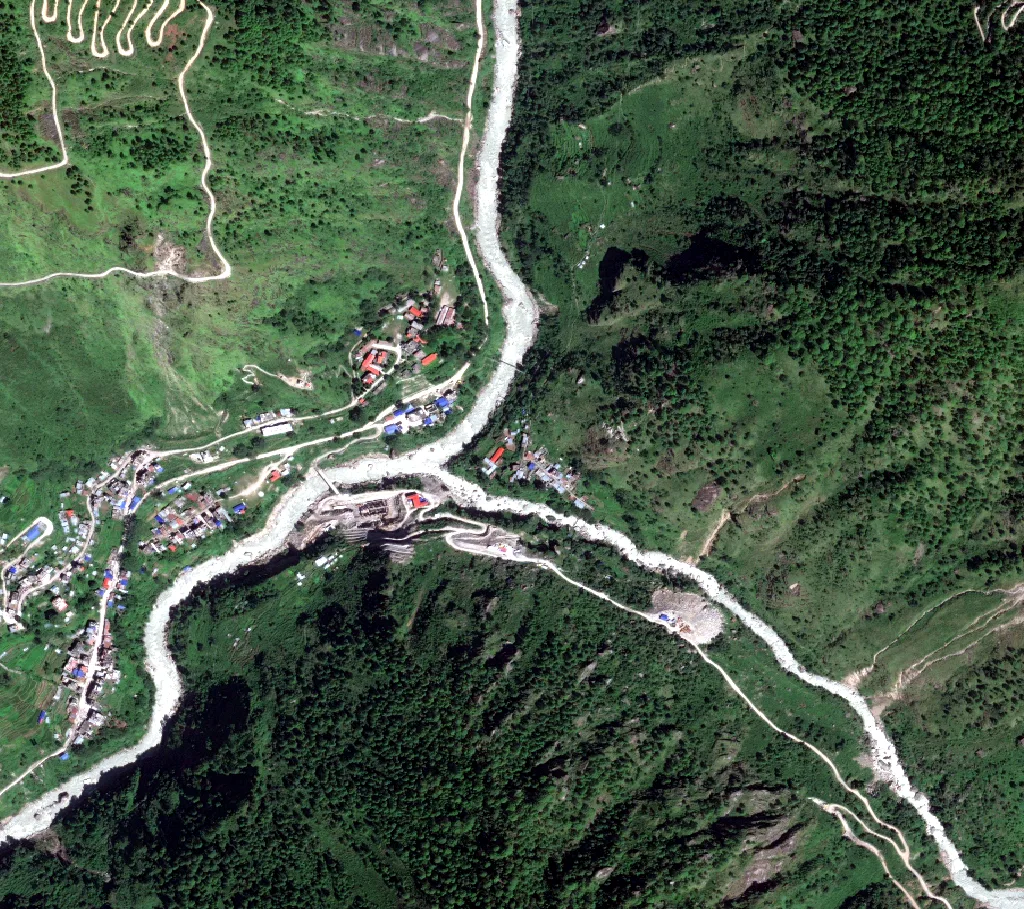
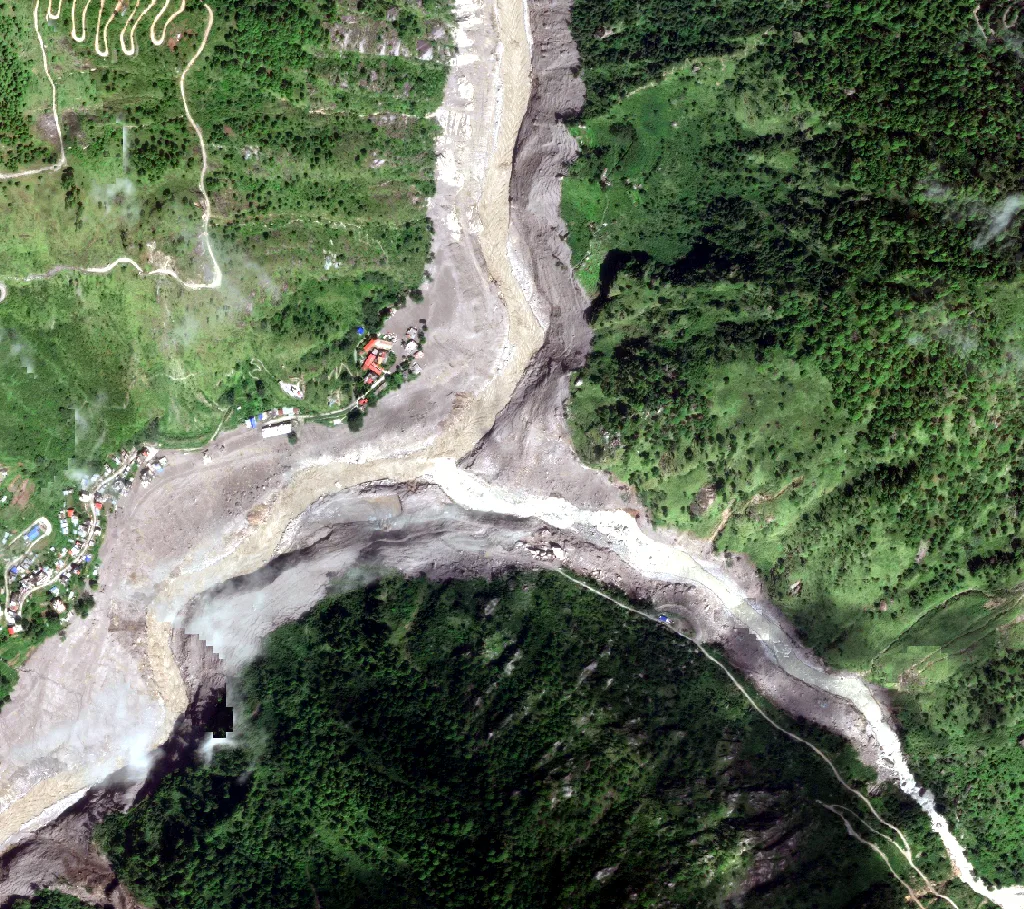
Before and after
Very-high-resolution imagery from before the event and from the days after it, and PlanetScope from the morning itself.
Open data, three questions
Rapid-mapping services such as Copernicus EMS map damage in selected areas within days, but not the whole corridor. Open satellite archives, open building and road data and public timing records now make a corridor-wide, validated reconstruction possible without commercial data.
- AWhat area did the event affect along the corridor, and how closely does an open-data footprint reproduce official damage mapping?
- BWhich buildings, roads, bridges and hydropower sites lay inside the footprint, and how complete are the open datasets that list them?
- CWhen did the flood front reach each settlement, and how much warning was, or could have been, given?
| Dataset | Used for | Detail |
|---|---|---|
| Sentinel-2 surface reflectance, Cloud Score+ | Optical change | Medians of 27 Aug to 28 Oct, 2025 and 2026; bands B2, B3, B4, B8, B11, B12 |
| Sentinel-1 GRD, VH, IW | Radar change | Relative orbit 85; 1 Jul to 25 Aug and 26 Aug to 14 Sep 2026 |
| Vantor Open Data | Before and after views | 0.35 to 0.65 m; WorldView-2, -3, Legion |
| Planet Disaster Data | View hours after the collapse | PlanetScope 3.8 m; 26 Aug 2026, 05:01 and 05:45 UTC |
| MERIT Hydro | Corridor, valley floor, river profile | 90 m upstream area, height above nearest drainage, elevation |
| Copernicus EMS EMSR927 | Validation reference | Syabrubesi, Timure and Bidur grading maps; 3,922 graded buildings |
| Google Open Buildings v3 | Building exposure | Pre-event footprints; confidence 0.75 or more |
| OpenStreetMap | Roads, bridges, hydropower | Overpass extract of 30 Oct 2026 |
| Event timing | Flood-front calibration | Video at Gyirong Port; gauges at Syabrubesi and Betrawati; SMS alert |
Open Buildings does not cover China, so the Tibetan part of the corridor, including Gyirong Port, has no building data.
Where the ground changed
We compared satellite pictures of the valley from the same time of year, before and after the flood, and marked every spot that had changed.
- 1Green that disappeared. Forest, fields or grass that were there before the flood and gone after it, scraped away or buried.NDVI (a satellite measure of how green and leafy the ground is) fell by more than 0.1 between the before and after pictures: Sentinel-2 averages of 27 Aug to 28 Oct, 2025 and 2026, with clouds removed by Cloud Score+.
- 2Bare ground covered by new debris. Riverbeds, river banks, roads and roofs had no plants to lose, so step 1 cannot see them. Here we look for a strong change of colour instead, such as grey river sand buried under brown mud and boulders.Change-vector magnitude d (how far a spot’s colour moved across six colour bands, equation 1) above 0.08. In steps 1 and 2 alike, the spot must look like bare mud, rock or water after the flood: NDVI after below 0.35.
- 3A second, independent check by radar. Clouds can hide the ground in the pictures of steps 1 and 2. Radar satellites see through cloud, so we ask them too. Where the radar also saw a change, we are more sure.Sentinel-1 radar echo (VH backscatter) changed by more than 4 dB, about 2.5 times stronger or weaker. Before and after are compared from the same satellite path (relative orbit 85), so the viewing angle is identical, and the grainy noise of radar (speckle) is smoothed over 50 m. Places found by both pictures and radar form the higher-confidence class.
- 4Only the flood’s path. Not every change in the valley was this flood. We keep only the valley floor along the river it ran down, and drop snow, cloud, high slopes, other rivers and tiny specks.Valley floor: less than 150 m above the nearest river (height above nearest drainage, MERIT Hydro). Snow, ice and cloud: snow index NDSI above 0.4, or very bright blue (reflectance above 0.25), in either picture. Corridor: the main river where more than 2,500 km² of land drains into it, plus 1 km either side and the Lhende Khola valley; this leaves out the river above the border in Tibet (2,141 km²) and the Tadi (551 km²) and Langtang (519 km²) side rivers. Specks: patches under 20 pixels (0.8 ha, about one football pitch) are dropped.
The result is 22.0 km² of changed ground: a ribbon along the river from the source of the flood down to Bidur. Untouched valleys next to it stay clear. Most of it was found in the pictures alone (18.8 km²); radar mostly confirmed the same places (2.9 km² flagged by both, 0.2 km² by radar alone).
| Piece | What it means | Area | Share |
|---|---|---|---|
| Optical only (red stripes) | Found in the satellite pictures (steps 1 and 2); radar saw no clear change there. | 18.83 km² | 86 % |
| Both (crossed stripes) | Found by the pictures and by radar. Two independent checks agree, so these are the surest places. | 2.94 km² | 13 % |
| Radar only (blue stripes) | Only radar saw a change: most likely where cloud hid the ground in the pictures, or where the change showed in the radar echo but not in the colour. | 0.21 km² | 1 % |
- Our footprint: optical only
- radar only
- both (higher confidence)
- Copernicus experts’ damage outline
- Edge of the area Copernicus mapped
Checked against Copernicus
Against the Copernicus EMS rapid mapping of the event, the footprint reaches F1 scores of 0.83 to 0.89, with precision of 0.93 to 0.98. The misses lie at the margins of the mapped extent.
The thresholds were not set by hand. A sweep of 1,008 combinations was scored against the EMSR927 mapped extent inside each area’s analysed region, on a 20 m grid. Leave-one-area-out tuning chose settings on two areas and scored them on the third. The Langtang Khola valley, untouched in 2026, served as a control: settings that flagged more than 2 % of its valley floor were rejected.
| Area | Precision | Recall | F1 | IoU |
|---|---|---|---|---|
| Syabrubesi (AOI01) | 0.98 | 0.81 | 0.89 | 0.80 |
| Timure (AOI02) | 0.98 | 0.73 | 0.84 | 0.72 |
| Bidur (AOI03) | 0.93 | 0.76 | 0.83 | 0.72 |
- First rule, no change vector
- Chosen rule
- Held out (leave one area out)
Adding change vector analysis raised F1 most at Timure, because much of its debris buried ground that was already bare. Held-out scores were 0.90, 0.84, 0.84, close to the in-sample values, and all three folds chose nearly the same thresholds.
The control limit mattered. The best setting without it flagged 5.3 % of the untouched Langtang valley floor, against 1.5 % for the chosen one.
What lay in its path
The footprint contains 92 % of the buildings Copernicus graded as destroyed (2,936 of 3,174), 87 % of the 56.8 km of road graded destroyed, and all 30 destroyed bridges within 40 m.
Buildings count as inside when their 20 m pixel is flagged. Road length inside is sampled every 5 m along each line. Bridges count within 40 m of the footprint, hydropower sites within 100 m, since both sit at the river’s edge.
- Graded by Copernicus
- Inside our footprint
- Our footprint (this study)
- Building Copernicus graded, inside our footprint
- outside it
- Road Copernicus graded destroyed, mostly inside
- mostly outside
- Bridge Copernicus graded destroyed
- Edge of the area Copernicus mapped
Open data undercount what was hit
Along the corridor, 2,519 of the 14,808 Open Buildings footprints lie inside the footprint. But within the Copernicus areas, Open Buildings holds fewer buildings than Copernicus graded as destroyed: Copernicus photo-interprets every structure on post-event imagery, while Open Buildings is mapped from earlier imagery with a confidence cut-off.
The footprint holds 50.8 km of OpenStreetMap road and 24 bridges, 18 for roads and 6 for pedestrians, against 53 footbridges the government assessment reports damaged. Five named hydropower plants lie within 100 m of it: the Chilime powerhouse, the Trishuli dam and power station, Upper Trishuli 3A and the Upper Trishuli 3B powerhouse, with four unnamed weirs and dams. Two other projects on the corridor, Rasuwagadhi and Upper Trishuli 1, are not in OpenStreetMap.
Exposure counts from open data are therefore a lower bound, and rapid loss estimates built on them will run low.
- Copernicus, graded destroyed
- Open Buildings footprints
How much warning there was
The front reached Syabrubesi about 12 minutes after the collapse, 26 minutes before the SMS alert, and Betrawati about 43 minutes after it.
The river profile is the MERIT Hydro main stem, ordered downstream by upstream area, with bed slope S smoothed over 500 m either side. From Rasuwagadhi to Syabrubesi the front is a debris flow at a steady speed of at most 52 m/s, the speed observed between the collapse and Gyirong Port. Below Syabrubesi it is a kinematic flood wave whose celerity follows Manning’s equation:
The single unknown k is fitted to the observed timing: Gyirong Port 7 minutes after the collapse, Syabrubesi by 13 minutes (its gauge stopped transmitting at 08:50), and Betrawati at 38 to 48 minutes, a ±5 minute band around 09:20, when its gauge stopped transmitting. A Monte Carlo of 10,000 draws across these windows gives the arrival times and their 5 to 95 % ranges.
- Model median, 5–95 %
- Extrapolated below Betrawati
- Observed time or window
- SMS alert
- Automatic alert (what-if)
- Flood arrived first
- Minutes of warning
| Place | Arrival, NPT | Warning from the SMS alert, min | ||
|---|---|---|---|---|
| Rasuwagadhi | 08:44 | −31 | ||
| Timure | 08:45 | −30 | ||
| Syabrubesi | 08:49 | −26 | ||
| Chilime powerhouse | 08:51 | −24 | ||
| Upper Trishuli 3A | 09:13 | −2 | ||
| Upper Trishuli 3B | 09:17 | +2 | ||
| Betrawati | 09:20 | +5 | ||
| Trishuli power station* | 09:35 | +20 | ||
| Trishuli Bridge, Bidur* | 09:38 | +23 | ||
| * Extrapolated below Betrawati, past the last observation. Negative: the front passed before the alert went out. Arrival is the model median; 5–95 % in minutes after the collapse. | ||||
The fitted model implies a flood depth of 5.5 to 8.5 m (median 6.7 m, Manning’s n = 0.05), of the same order as the 9 m rise in 30 minutes that ICIMOD reported on the Trishuli at Galchhi, further downstream, although depth was not used in the fit.
The Flood Forecasting Division learned of the flood at 09:05, and SMS alerts went out at 09:15, after the front had passed Timure and Syabrubesi and as it reached the Upper Trishuli plants and Betrawati. Near the border, even an instant automatic alert gives only 5 to 10 minutes. Further downstream the time existed but was not used: an alert triggered automatically, from the collapse’s seismic signal or from upstream sensors with data shared across the border, would have given 34 to 41 minutes at the midstream hydropower sites and Betrawati.
What open data can and cannot do
Open data reproduced the official damage mapping within nine weeks of the event and without commercial imagery. Three choices made the difference: change vector analysis for debris on already-bare ground, an event corridor that keeps other rivers and the late-September rains out, and a control valley that stopped tuning from rewarding false alarms outside the reference areas.
Two attempts failed and are worth reporting. Ending the Sentinel-2 window before the 24 to 28 September rains left too few cloud-free monsoon scenes, and F1 fell to 0.1 to 0.3. A snow mask widened by 100 m erased much of the corridor, because water and wet debris pass the snow index test as well as snow does.
Limitations
- 1The timing observations come from news reports compiled after the event, and a gauge falling silent may partly reflect telemetry failure rather than the flood’s arrival.
- 2The flood model is first-order and one-dimensional and ignores attenuation, so its downstream arrival times are early and its downstream warning times are minimums. A 2D hydraulic model would refine them.
- 3MERIT Hydro’s 90 m grid limits the river profile and the valley mask.
- 4Validation is possible only where Copernicus mapped: three areas, with one control valley.
- 5Our map misses part of what Copernicus mapped. In its three areas the footprint misses 19 % to 27 % of the damage Copernicus outlined (recall 0.73 to 0.81), and 2 % to 7 % of the footprint lies outside that outline. The misses lie mostly at the edges. Likely reasons, not separately tested: our pixels are 20 m across and patches under 0.8 ha are dropped, while Copernicus traced 0.5 m imagery by hand, so thin strips at the margins are lost; some flooded ground changed too little to pass the rule, such as a thin layer of silt or plants that survived or grew back before the late-October images; and in the narrow gorges radar cannot add a second look. The ground outside the outline may be change from the late-September rains, or damage Copernicus did not draw.On the map, compare our footprint with the solid black Copernicus outline. The dashed line only marks where Copernicus looked, not damage.
- 6The Sentinel-2 window runs to 28 October, so main-stem changes from the late-September rains cannot be separated from the August event, and Open Buildings comes from imagery that predates the event by several years.
The flood reached the border settlements within minutes, before any warning could be issued, but the midstream hydropower sites and towns had 34 to 41 minutes that an automatic alert could have used. For Nepal’s transboundary valleys, investment in automatic detection and data sharing is likely to save more lives than faster mapping after the fact.
Code and citation
Every number on this page is read from the rasuwa package’s outputs when the site is built. The package has one module per analysis and a command-line step for each. The footprint is released as 20 m GeoTIFF tiles (UTM 45N) with the scores and counts as JSON. Code, footprint and results are archived on Zenodo at doi.org/10.5281/zenodo.23887627.
python -m rasuwa export          # footprint into data/footprint/, tile by tile
python -m rasuwa footprint       # areas and map
python -m rasuwa validate        # scores against Copernicus EMSR927
python -m rasuwa buildings
python -m rasuwa infrastructure
python -m rasuwa leadtime
python -m rasuwa web             # map layers and imagery for this site
Acharya, N., and Pathak, S. Downstream impacts and warning lead time of the 26 August 2026 Bhote Koshi–Trishuli cascade, Nepal, from open multi-sensor data. In preparation, 2026. Code: github.com/Nischal642/rasuwa-2026-cascade. Data: doi.org/10.5281/zenodo.23887627